Player prop research
How a half-point changed NBA prop hit rates
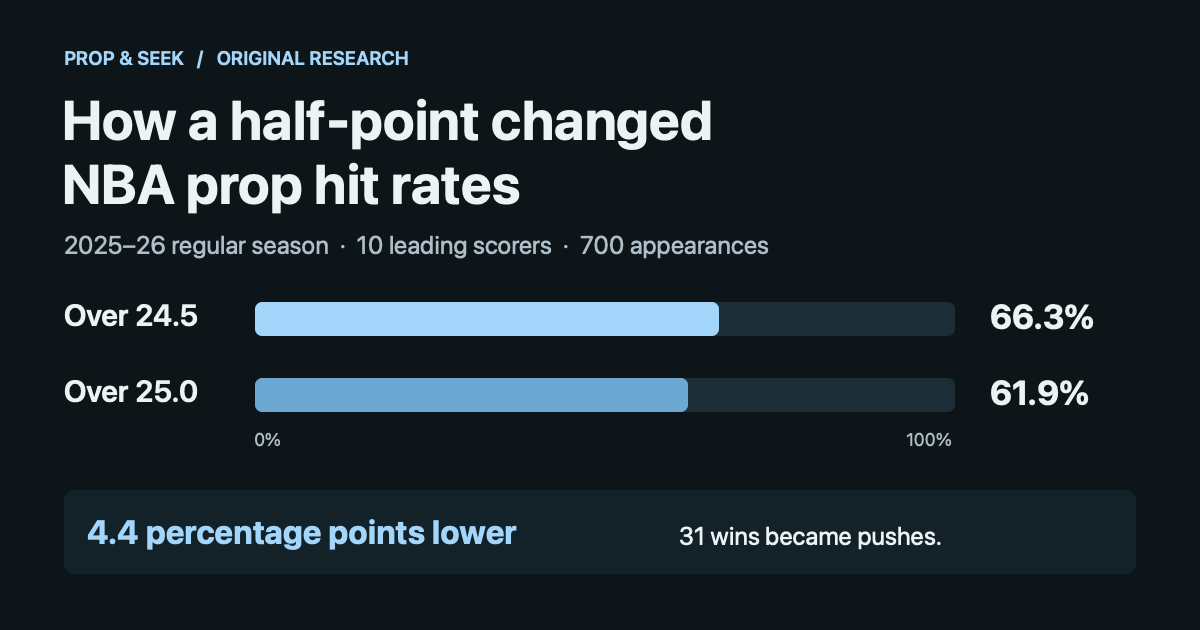
Raising an NBA points line from Over 24.5 to Over 25.0 lowered the historical hit rate from 66.3% to 61.9% across 700 appearances by the 10 leading scorers of the 2025–26 regular season. Exactly 25 points turned 31 wins into pushes, a drop of 4.4 percentage points.
Results at Over 24.5 and Over 25.0
| Window | Over 24.5 | Over 25.0 | Pushes at 25.0 |
|---|---|---|---|
| Last 5 | 58.0%29/50 wins | 50.0%25/50 wins | 4 |
| Last 10 | 63.0%63/100 wins | 56.0%56/100 wins | 7 |
| Season | 66.3%464/700 wins | 61.9%433/700 wins | 31 |
Season calculation: (433 + 31) ÷ 700 = 66.3% at Over 24.5. At Over 25.0, 433 ÷ 700 = 61.9%. The difference is 31 ÷ 700, or 4.4 percentage points.
Each window uses the same appearances at both lines. The drop was 8 percentage points in the last-five sample and 7 in the last-ten sample. Across the full season, the size of the drop depended on the threshold. Moving from Over 19.5 to Over 20.0 turned 27 wins into pushes out of 700 appearances, while moving from Over 29.5 to Over 30.0 turned 48 into pushes.
Why the half-point matters
At Over 24.5, a 25-point game is a win. At Over 25.0, the same game is a push. A total below 25 loses at both lines, and a total above 25 wins at both. With pushes included in graded games, the change in win rate is exactly the share of games that landed on 25.
The next half-point behaves differently. Moving from Over 25.0 to Over 25.5 changes those pushes to losses while leaving the win count and the graded-game denominator unchanged. The displayed hit rate can stay the same even though the outcomes differ. See how wins, losses and pushes are counted.
How we built the sample
We used recorded points from imported ESPN final box scores for the 2025–26 NBA regular season, October 21, 2025 through April 12, 2026, Eastern time. The archive covered 1,230 regular-season games. We excluded the NBA Cup final, play-in, playoffs, exhibitions, games without a known player points total and games the player did not play.
We ranked players by total regular-season points in the archive. Compare the totals with the NBA regular-season totals. The cohort was Luka Dončić, Shai Gilgeous-Alexander, Jaylen Brown, Kevin Durant, Tyrese Maxey, Donovan Mitchell, Jalen Brunson, Jamal Murray, Kawhi Leonard and Nikola Jokić.
For each player we took their five most recent appearances, ten most recent appearances and full regular season, then pooled each window separately. Each player-game contributes once per window, so players who appeared more often contribute more to the season result. The windows overlap. To reproduce the Over 25.0 result, count scores above 25 as wins and scores equal to 25 as pushes, then divide wins by all graded appearances.
What the study can tell you
These thresholds were applied to past box scores. The cohort was selected after the season by scoring volume, so the percentages describe this group of high scorers. The study did not track sportsbook prices or which lines were offered. It does not estimate a future hit rate or betting returns.
See the Kevin Durant walkthrough for how to check the player, market, side, line and sample on the web board. Read the research methodology for more about the live tools.